Product Design
Merchant Dashboard
I led the UX for Groupon merchant dashboard workflows. Project Iceberg’s goal is to surface relevant data and insights and enable a data-driven decision-making culture, which will help Groupon Merchants stay competitive with other vendors.
My Role
UX/UI Designer
I was the sole designer and led design for the entire lifecycle of the product.
Project Duration
Shipped MVP in 3 months
Identify and rolled out new widgets and detail pages after launch
Team Size
1 Designer
1 UX Researcher
Project Background
As the retail space becomes more crowded and competitive, the use of valuable data to make smarter decisions will play a crucial role.
The goal of Project Iceberg is to surface relevant data and insights and, enable a data-driven decision-making culture, which will help Groupon stay competitive with other retailers. It will also support stakeholders (merchants, buyers, operations, inventory managers, etc.) by providing actionable insights and tools (Dashboard) to analyze and improve Merchants’ performance and discover new areas of opportunity.
My UX Approach

Scope of Work in each stage (Deliverables)
Research Stage
- User research data, paint points and expectations
- Competitive market analysis data with features
- UX strategy Plan
- Personas
- Data and Widget list
- Design concepts high-level
Concept & Design Stage
- Dashboard Page structure
- All widgets detailed designs
- Rapid Prototype (Invision)
- Visual Design
- Design System (MIXER)
- Zeplin Mockup with Redline (Styles and component)
Business Presentation Stage
- Research Data (All Collected)
- Multiple Design concept presentations with metrics (Pre- and Post iteration)
- Rapid Prototype
- All User testing results (Optional)
User Research Data Analysis
The first step in my process was to dig into some of the data from user research team. This helped me understand the both GSOR and SSOR merchants expectation for merchant dashboard.
Competitive Research
I have done a deep competitive analysis to Identify features that competitors have and also compare the strengths and weaknesses of the current system with potential competitors. This analysis helps me learn and understand how Groupon’s competition works. I captured screenshots of all the widgets and features and created a business presentation for concept discussion. There are two types of competitors in the e-commerce and retail industry.
Direct competitors
Amazon and Walmart offering the same service or line of products as Groupon in the same geographical area – targeting the same audience and serving the same needs.

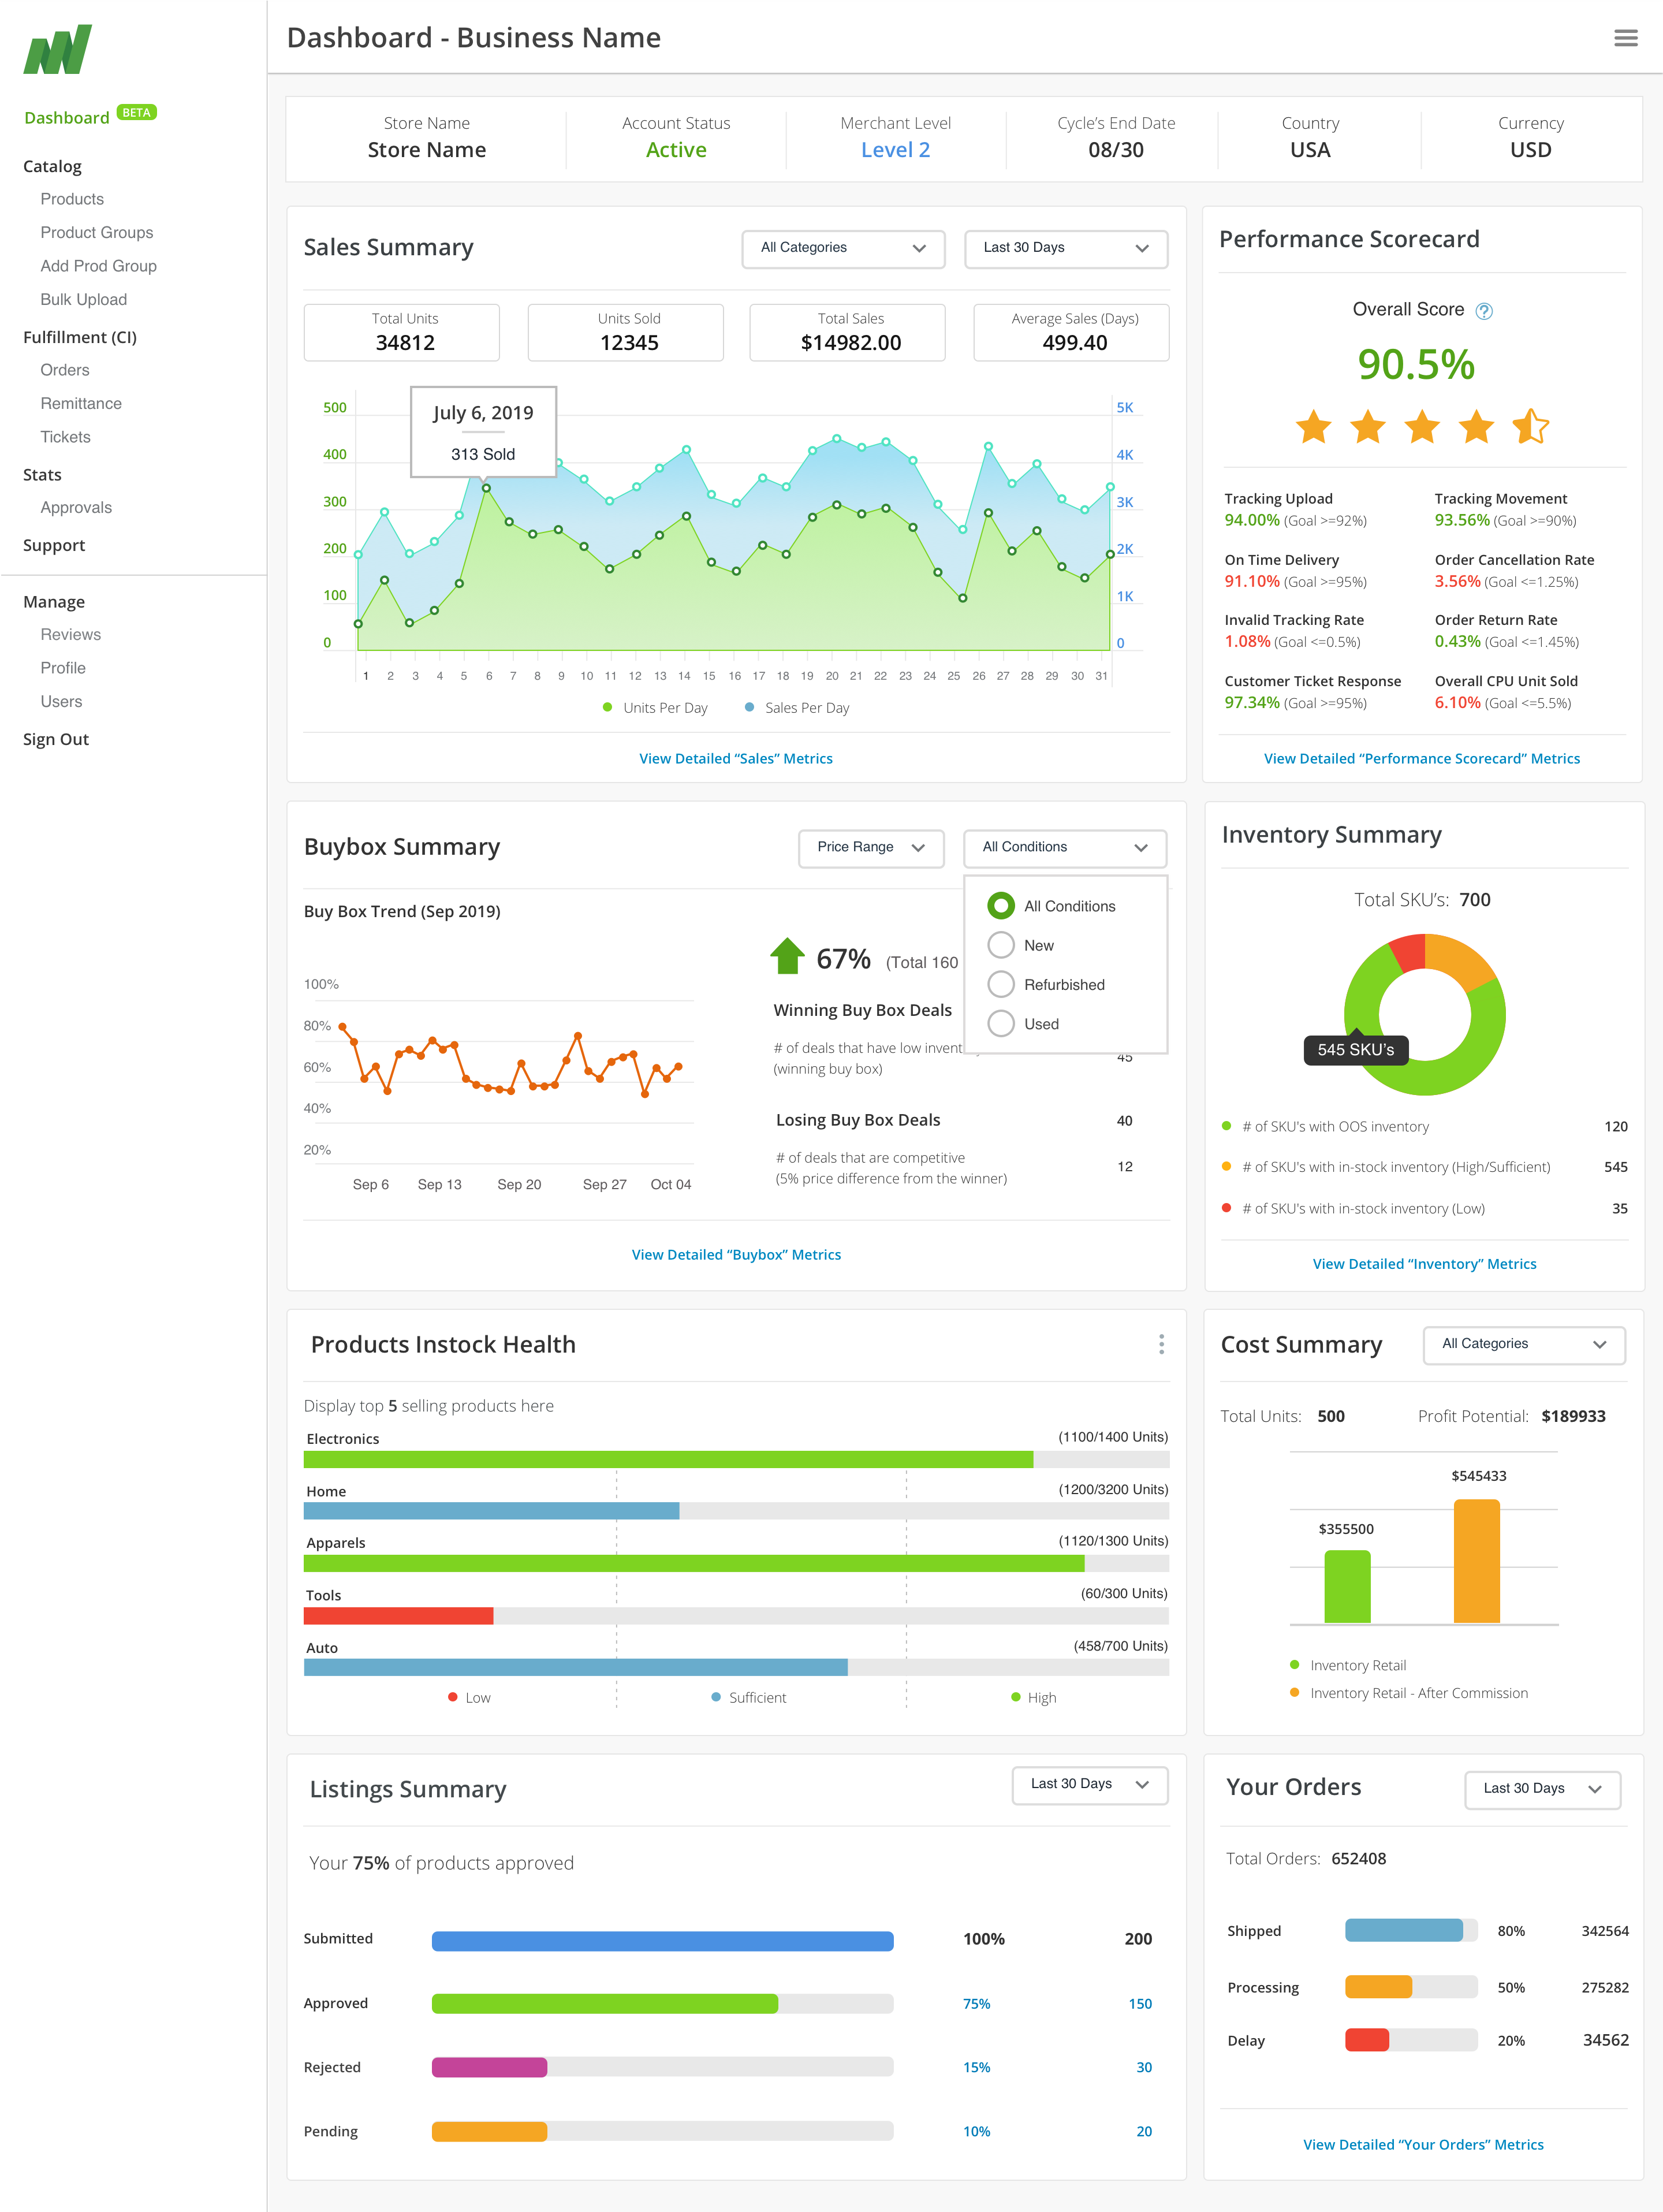
Merchant Dashboard User Flow (Expandable)
Based on stakeholder meetings and research I was able to determine the very high level user flows. I conducted brainstorming and white boarding sessions with product owner, engineering team and finally tool committee to validate the flows and widgets.
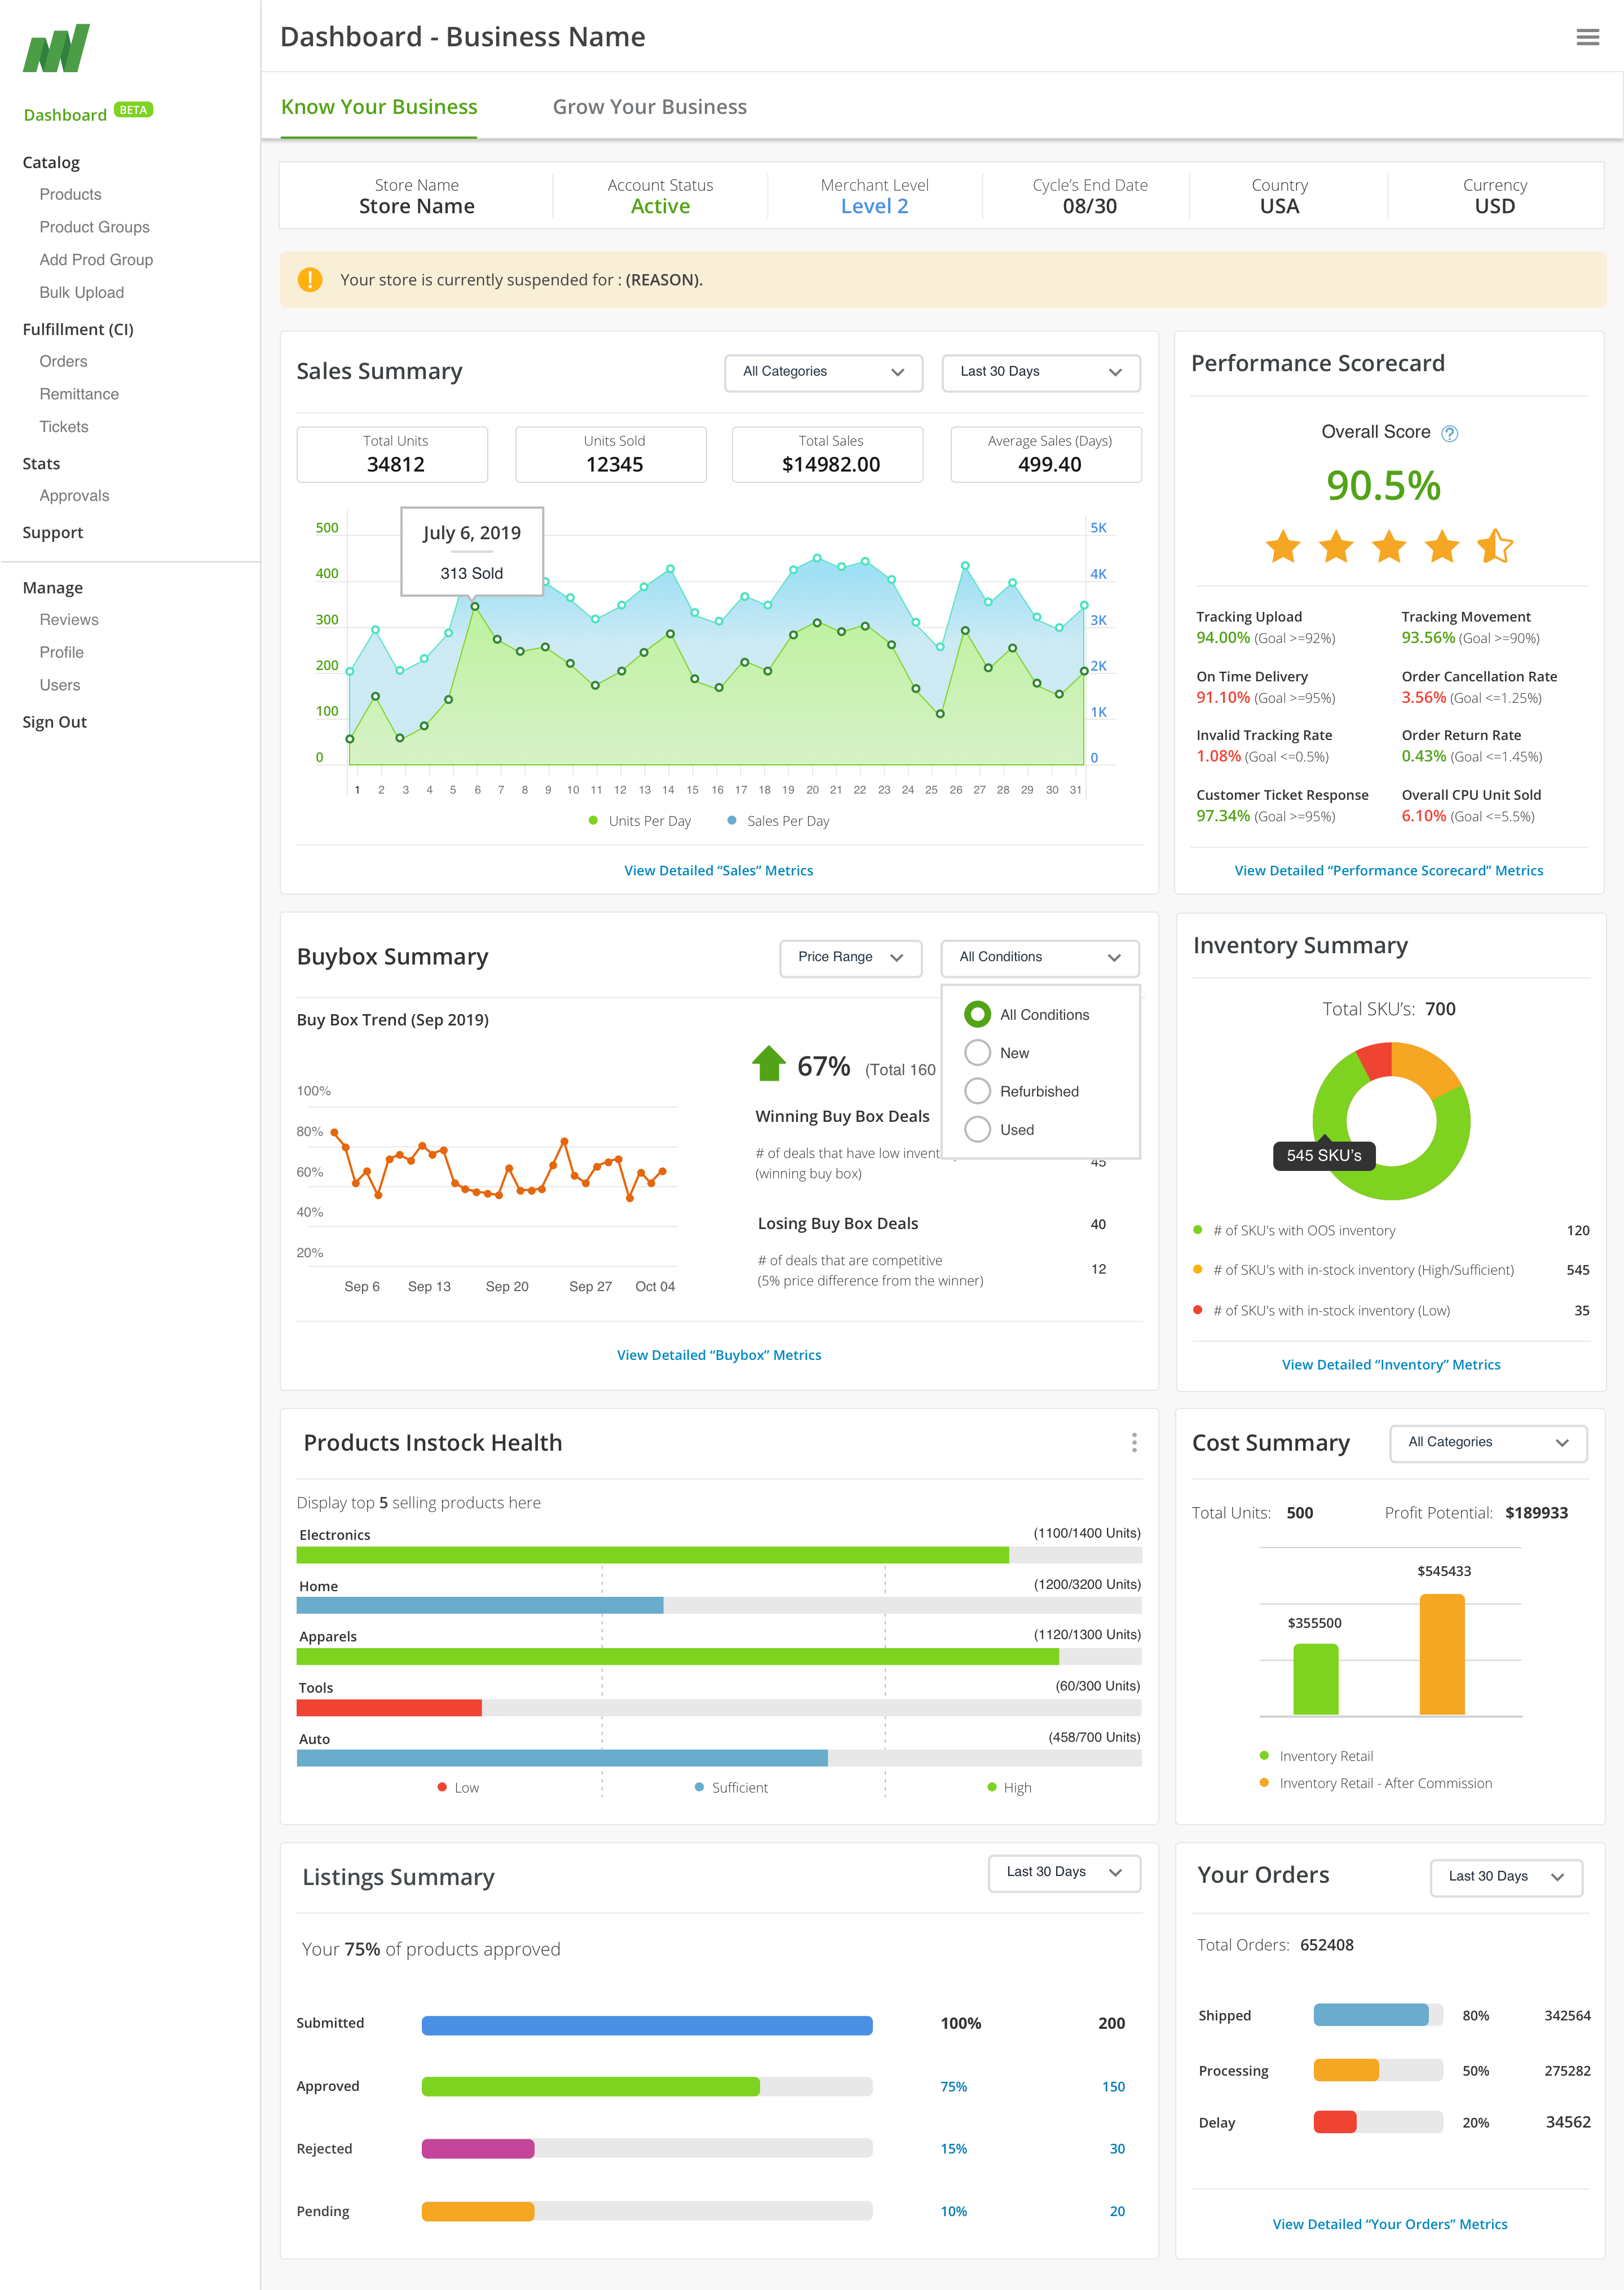
I designed user flows into two different major sections and Store Mode.
Know your business widgets
Widgets with information and filter for customization
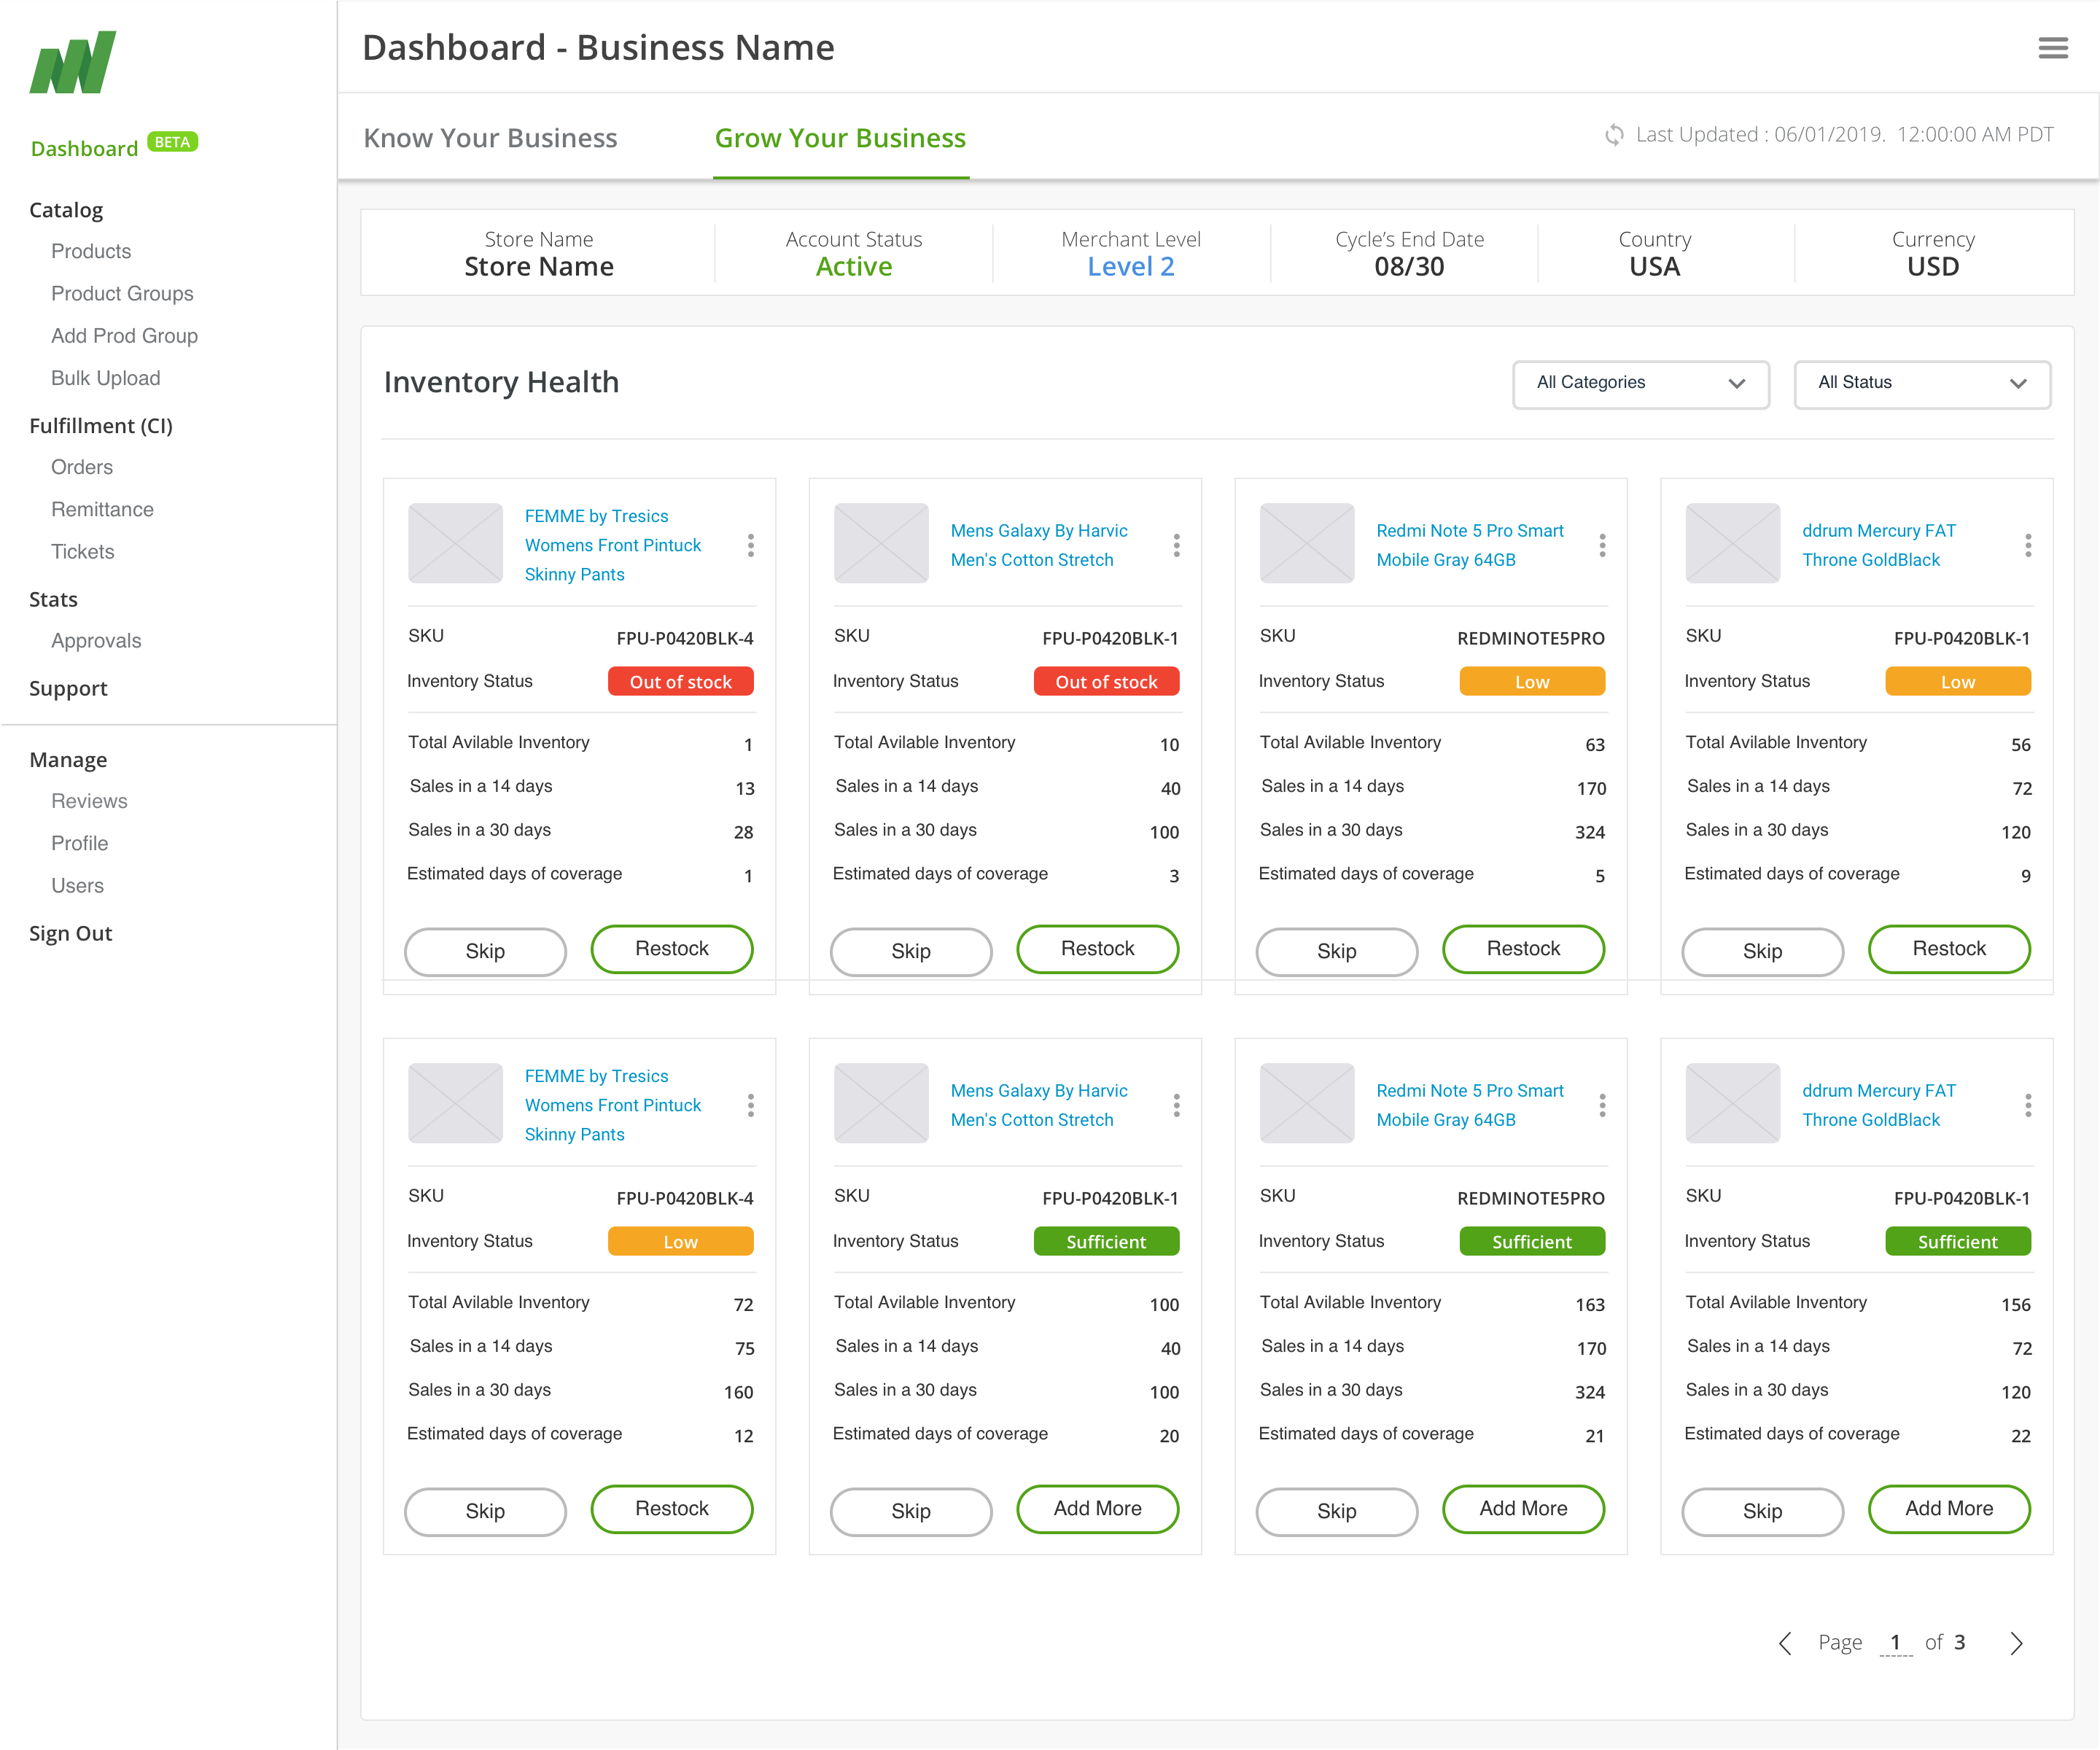
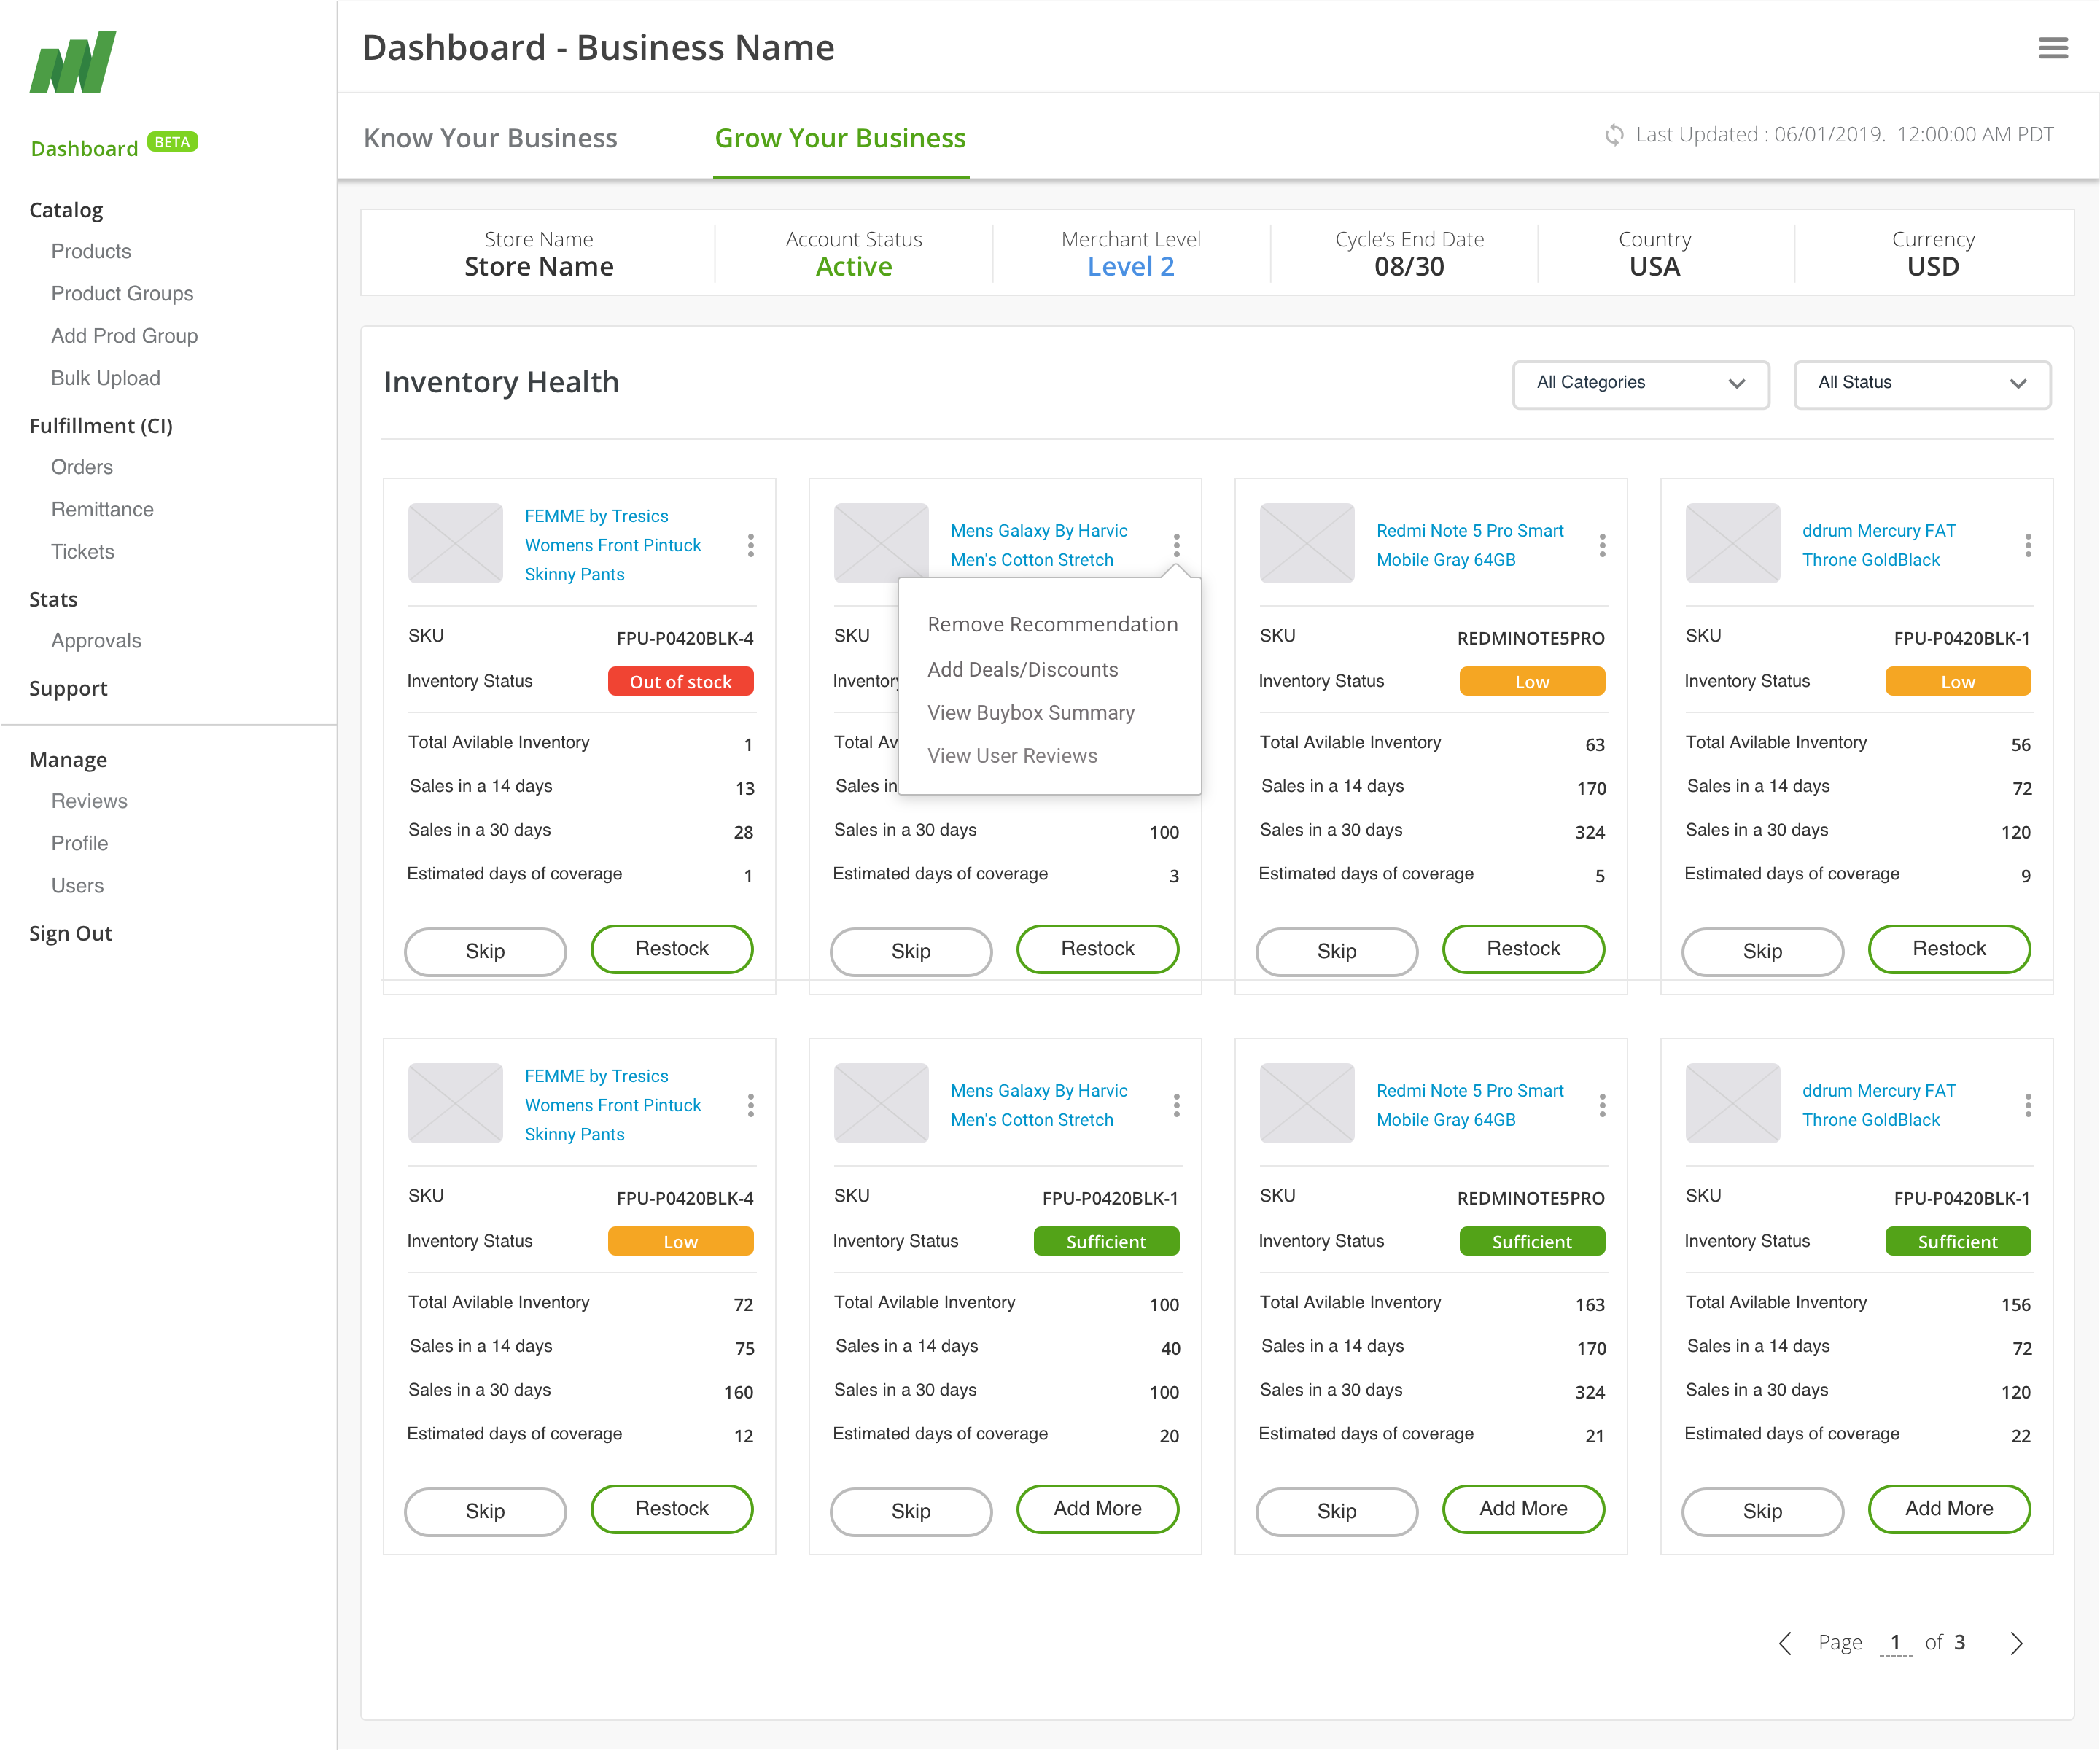
Grow your business Widgets
Widget with information and actionable buttons

Design Approach – MVP
Once the user flows and widget list were finalized, I used my most trusted skill, whiteboarding/sketching, to bring to life the ideas I had in mind. I used all the information I gathered from the UX exercises in the sketches. After a huge collaborative effort, I created 3 to 4 design concepts for each widget and presented them to the business for further refinement. My overall widget design process is as follows.
Requirement analysis
Basic research
Data Analysis
Data visualization
White-boarding and collaboration
2 to 3 high-level concepts creation (Basic and detail page)
Feasibility check with engineers
Product manager walkthrough and iteration
Business presentation and iteration
widget design and UI sign-off.
Widgets & Variations
Explored various widgets by brainstorming and whiteboarding with cross-functional teams.

User Testing – Survey – Gateway users – Pre Launch
User testing should be happening at every point in the process.
We created a Google survey form and a clickable rapid prototype using Imagine Studio for internal team early feedback. We conducted this user testing survey with the entire gateway team and selected merchant vendors. Cconsolidated all the feedback and comments for further iterations.

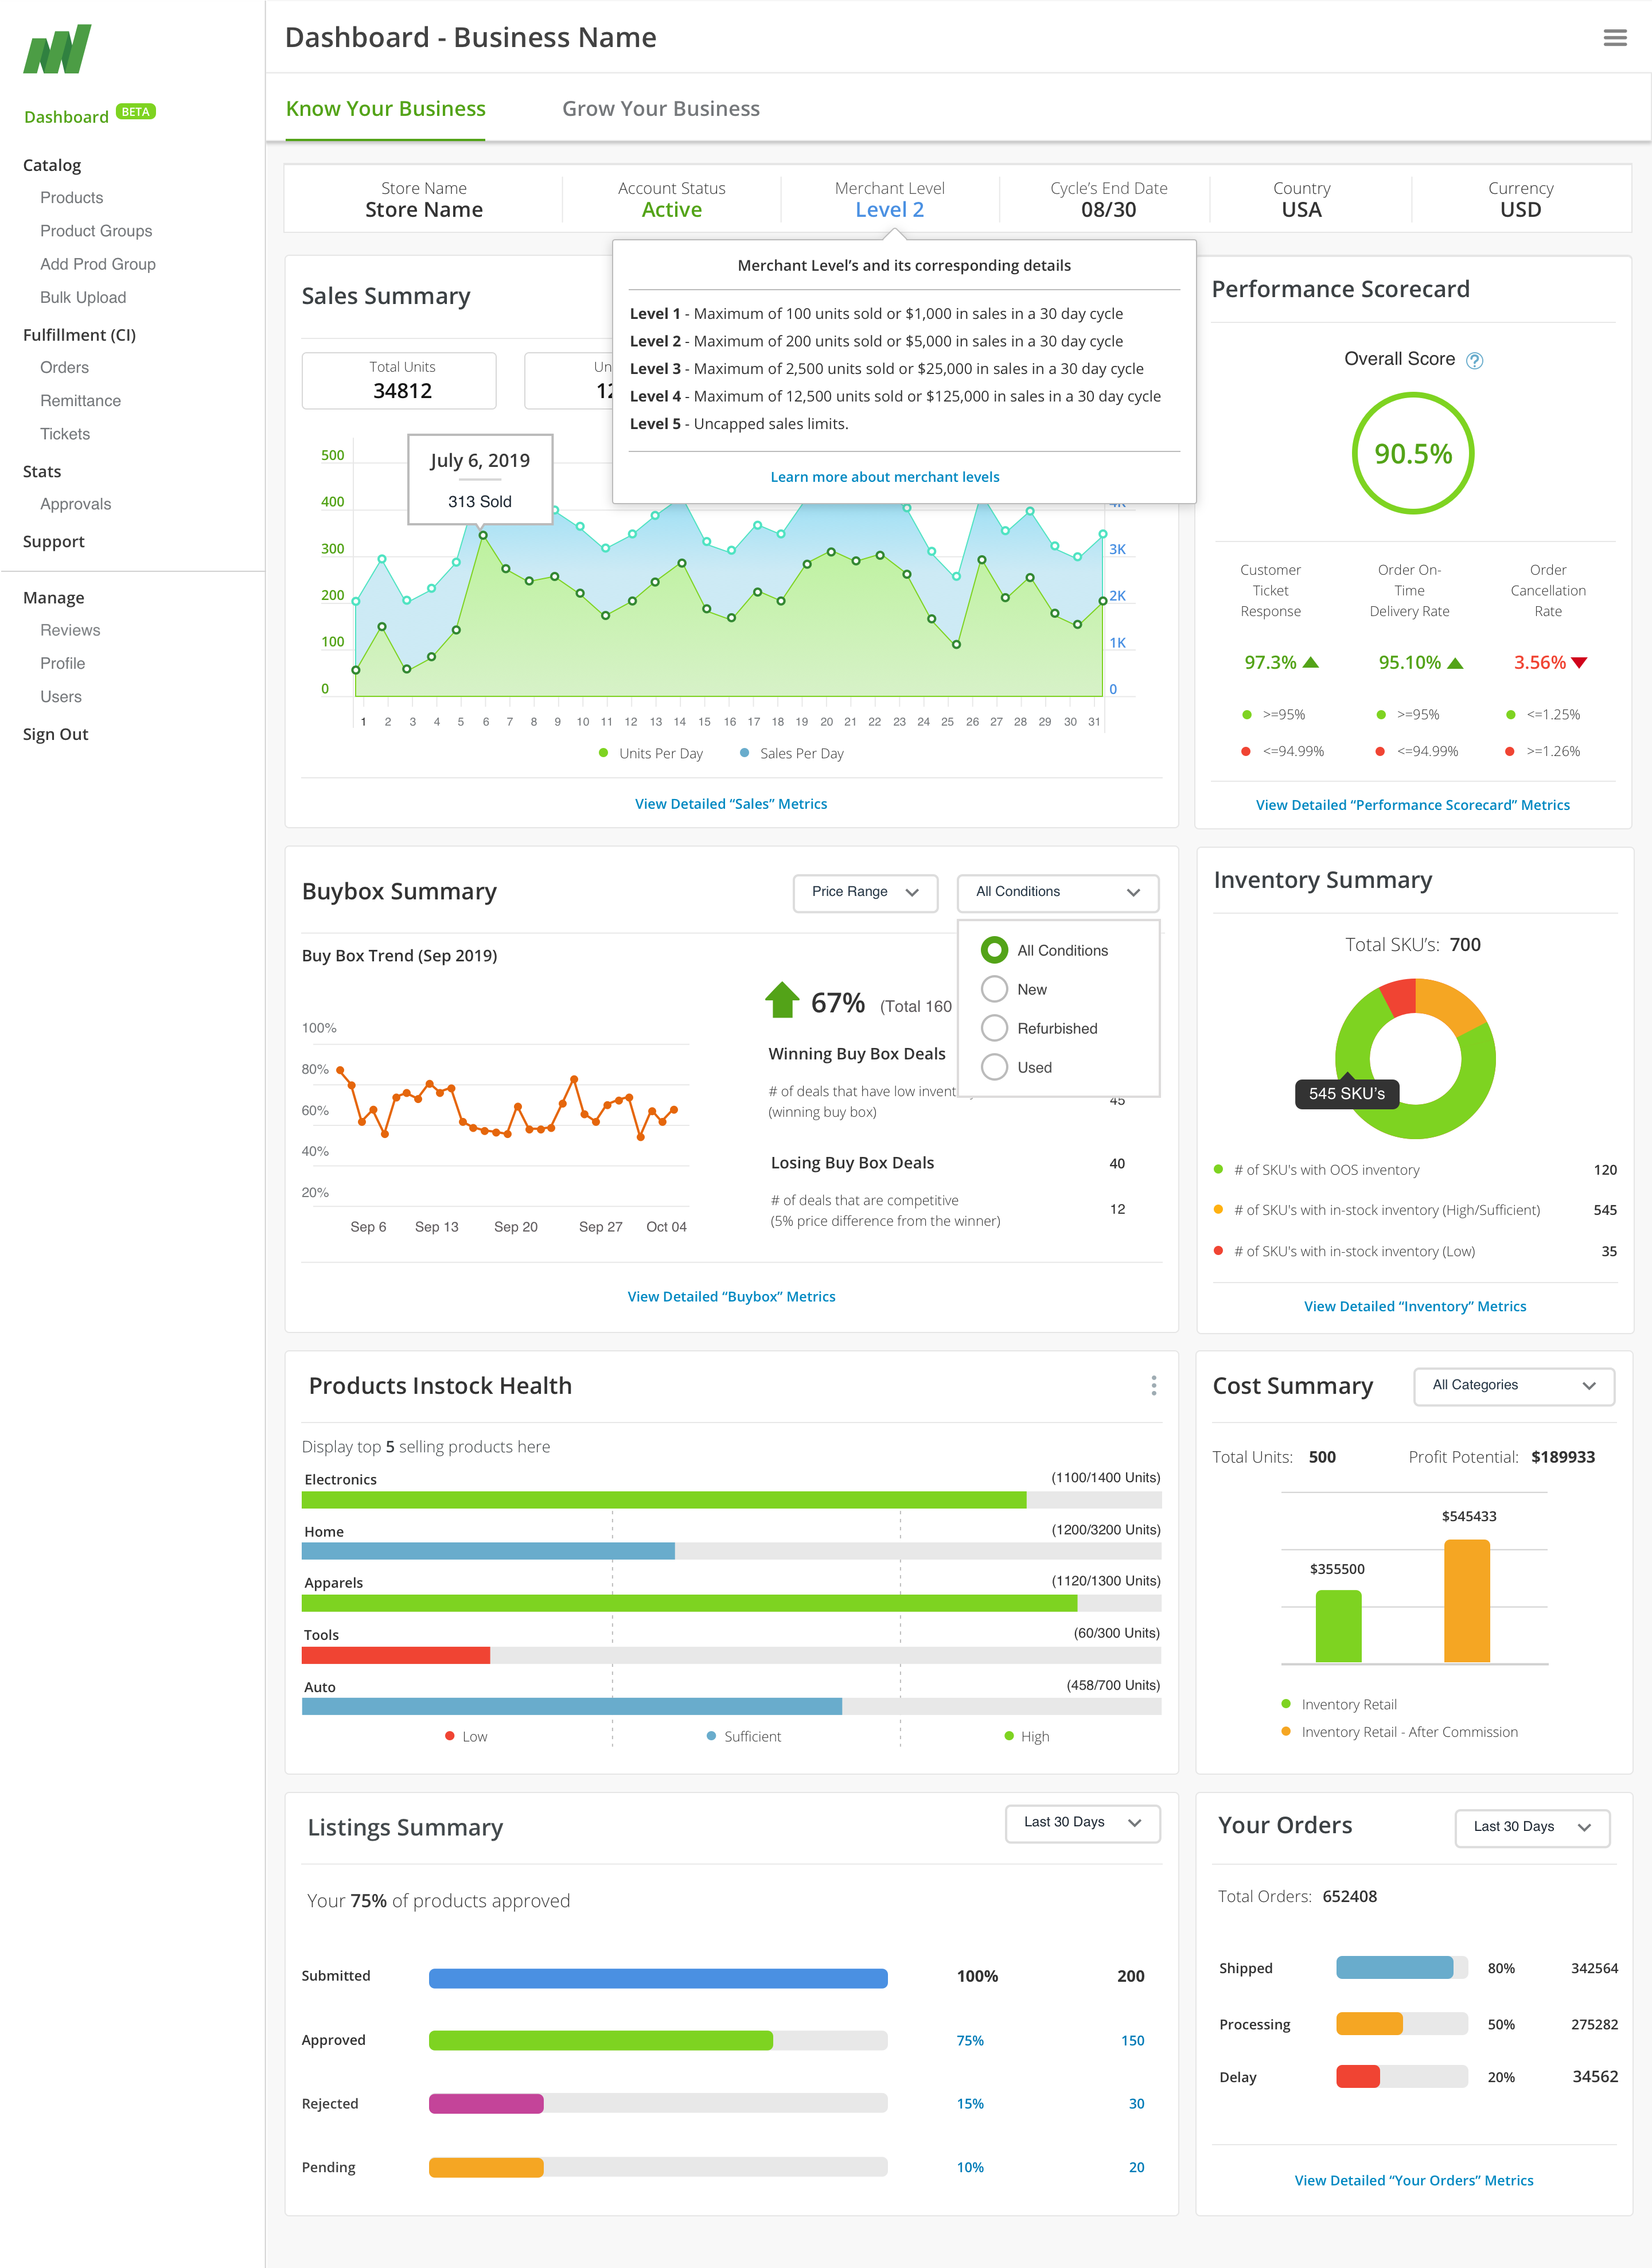
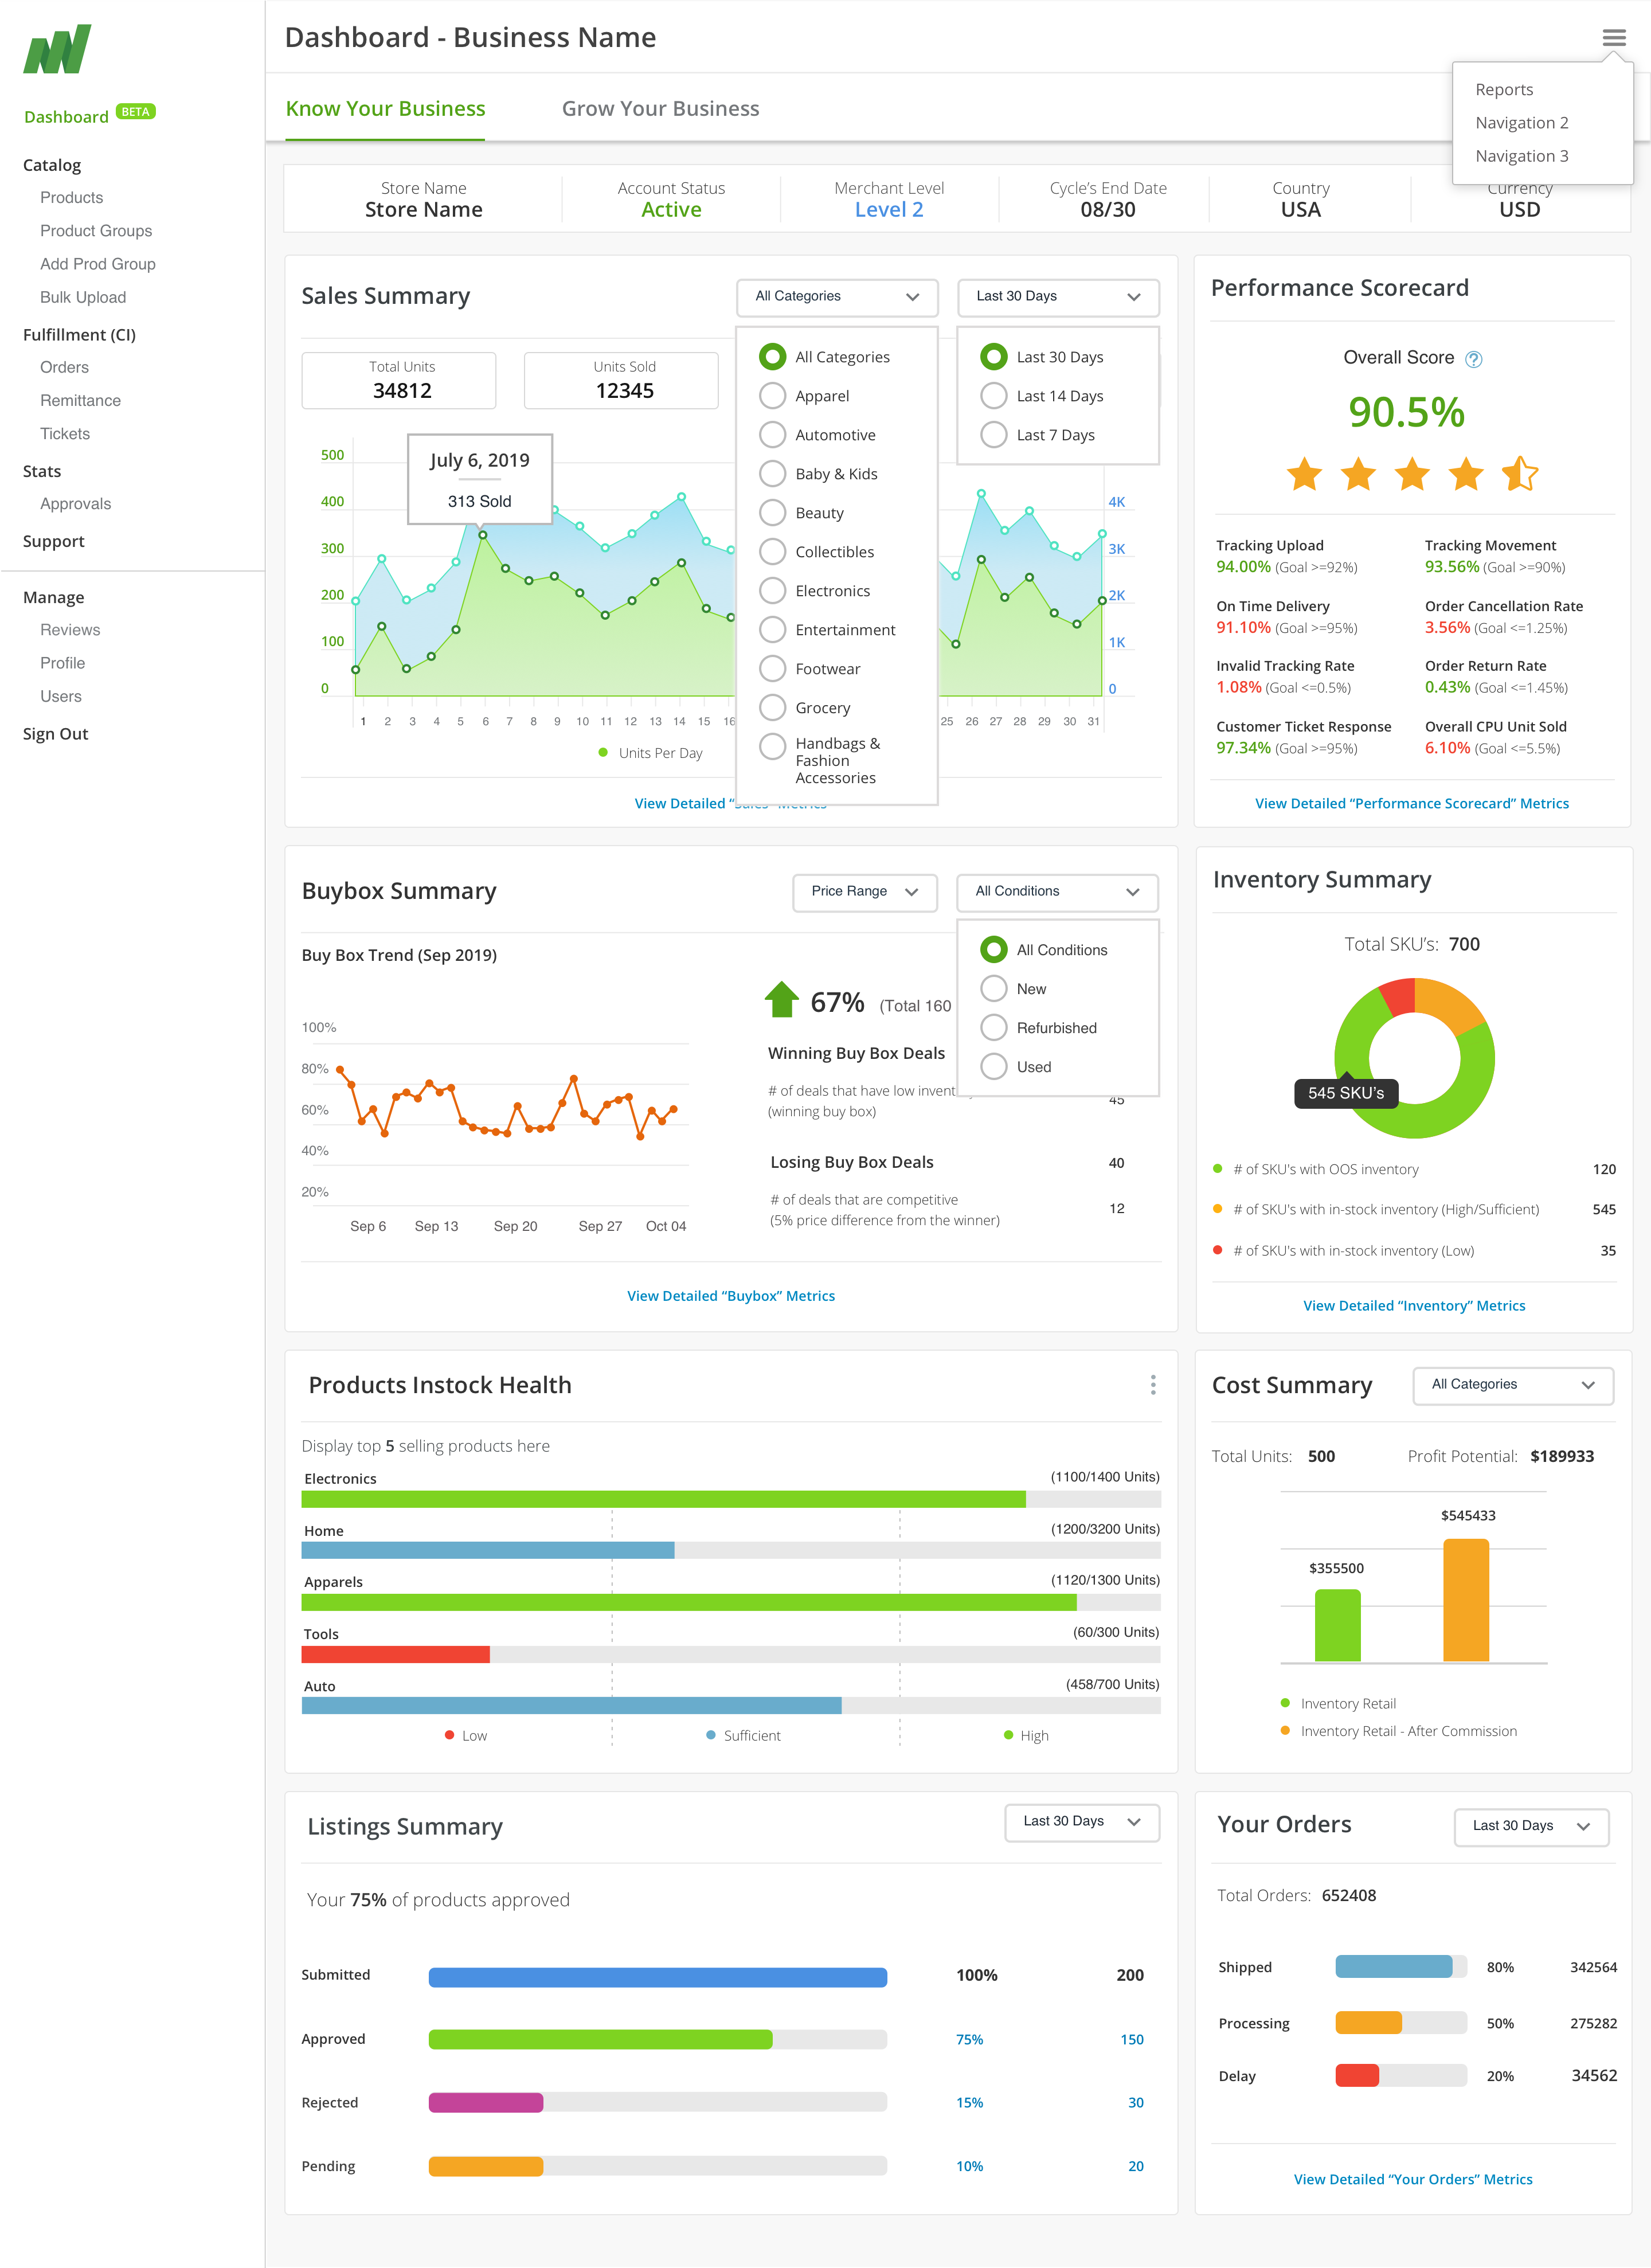
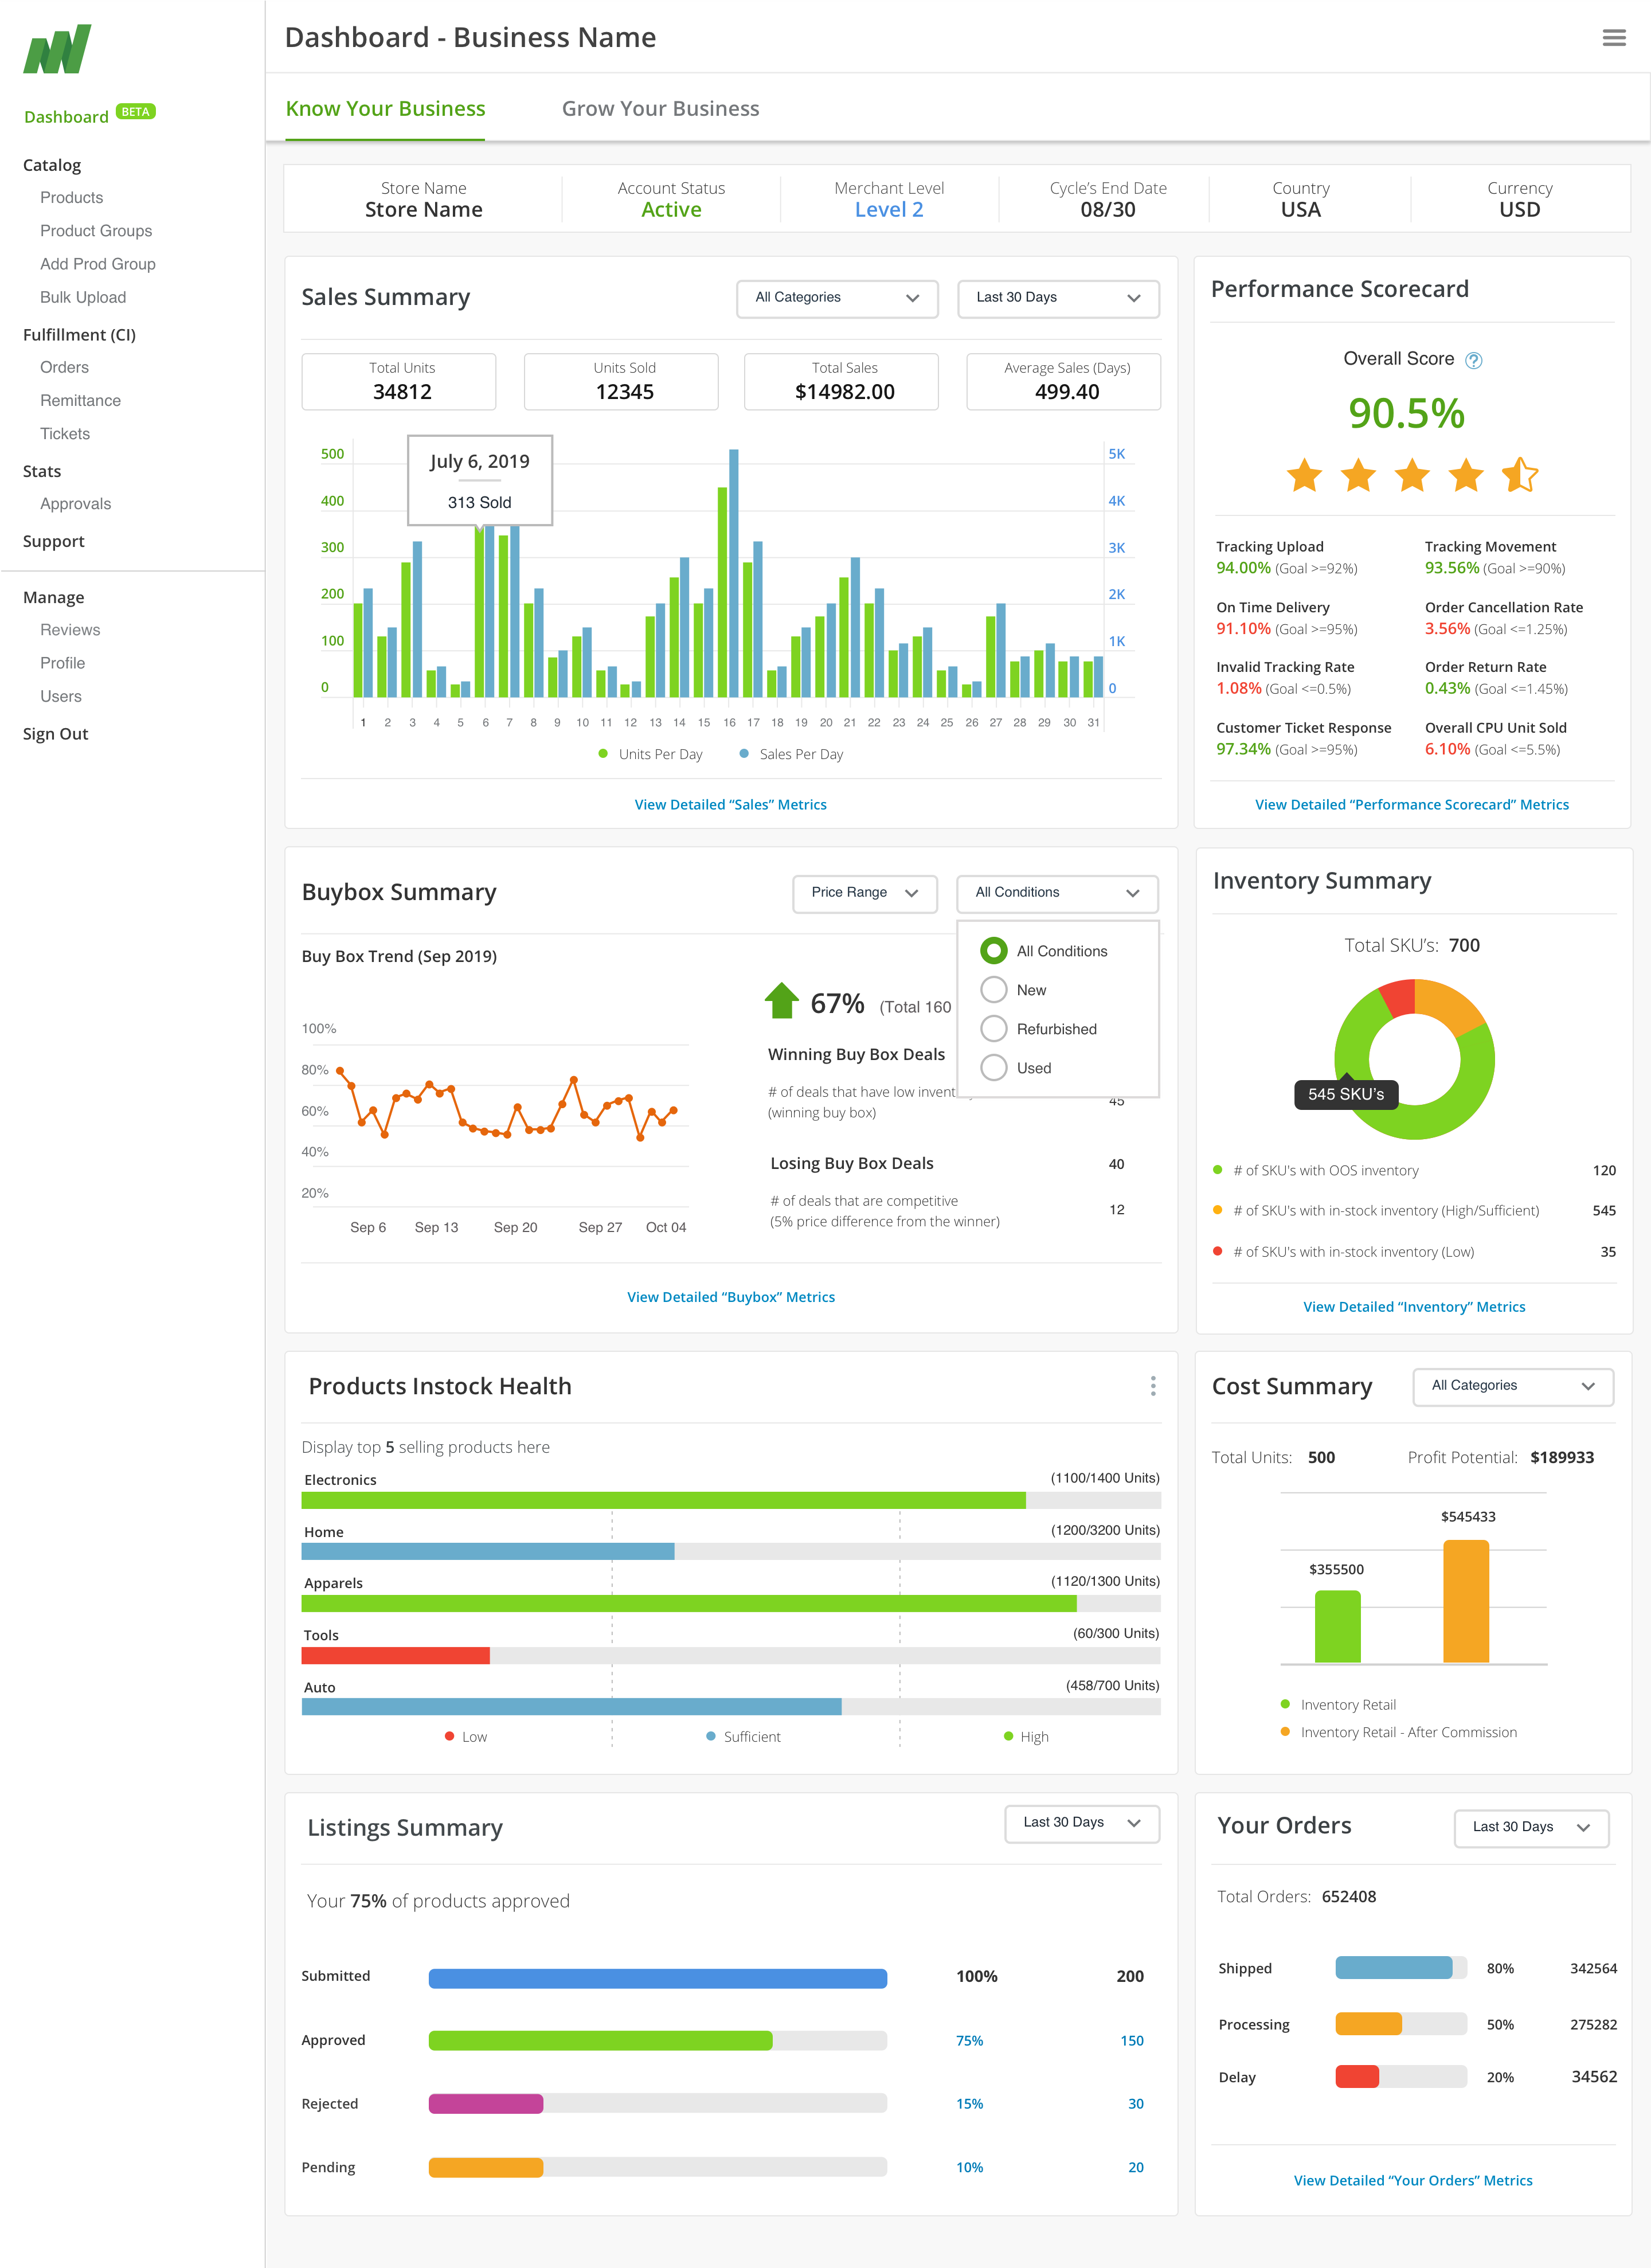
Final Design – Few Screens